> ## Documentation Index
> Fetch the complete documentation index at: https://nixtla-old-docs.mintlify.site/llms.txt
> Use this file to discover all available pages before exploring further.
# HINT
The Hierarchical Mixture Networks (HINT) are a highly modular framework
that combines SoTA neural forecast architectures with task-specialized
mixture probability and advanced hierarchical reconciliation strategies.
This powerful combination allows HINT to produce accurate and coherent
probabilistic forecasts.
HINT’s incorporates a `TemporalNorm` module into any neural forecast
architecture, the module normalizes inputs into the network’s
non-linearities operating range and recomposes its output’s scales
through a global skip connection, improving accuracy and training
robustness. HINT ensures the forecast coherence via bootstrap sample
reconciliation that restores the aggregation constraints into its base
samples.
**References** - [Kin G. Olivares, David Luo, Cristian Challu,
Stefania La Vattiata, Max Mergenthaler, Artur Dubrawski (2023). “HINT:
Hierarchical Mixture Networks For Coherent Probabilistic Forecasting”.
Neural Information Processing Systems, submitted. Working Paper version
available at arxiv.](https://arxiv.org/abs/2305.07089) - [Kin G.
Olivares, O. Nganba Meetei, Ruijun Ma, Rohan Reddy, Mengfei Cao, Lee
Dicker (2022).”Probabilistic Hierarchical Forecasting with Deep Poisson
Mixtures”. International Journal Forecasting, accepted paper available
at arxiv.](https://arxiv.org/pdf/2110.13179.pdf) - [Kin G. Olivares,
Federico Garza, David Luo, Cristian Challu, Max Mergenthaler, Souhaib
Ben Taieb, Shanika Wickramasuriya, and Artur Dubrawski (2022).
“HierarchicalForecast: A reference framework for hierarchical
forecasting in python”. Journal of Machine Learning Research, submitted,
abs/2207.03517, 2022b.](https://arxiv.org/abs/2207.03517)
Figure 1. Hierarchical Mixture Networks
(HINT).
## Reconciliation Methods
***
source
### get\_identity\_P
> ```text theme={null}
> get_identity_P (S:numpy.ndarray)
> ```
***
source
### get\_bottomup\_P
> ```text theme={null}
> get_bottomup_P (S:numpy.ndarray)
> ```
\*BottomUp Reconciliation Matrix.
Creates BottomUp hierarchical “projection” matrix is defined as:
$\mathbf{P}_{\text{BU}} = [\mathbf{0}_{\mathrm{[b],[a]}}\;|\;\mathbf{I}_{\mathrm{[b][b]}}]$
**Parameters:** `S`: Summing matrix of size (`base`, `bottom`).
**Returns:** `P`: Reconciliation matrix of size (`bottom`,
`base`).
**References:** - [Orcutt, G.H., Watts, H.W., & Edwards, J.B.(1968).
“Data aggregation and information loss”. The American Economic Review,
58 , 773(787)](http://www.jstor.org/stable/1815532).\*
***
source
### get\_mintrace\_ols\_P
> ```text theme={null}
> get_mintrace_ols_P (S:numpy.ndarray)
> ```
\*MinTraceOLS Reconciliation Matrix.
Creates MinTraceOLS reconciliation matrix as proposed by Wickramasuriya
et al.
$\mathbf{P}_{\text{MinTraceOLS}}=\left(\mathbf{S}^{\intercal}\mathbf{S}\right)^{-1}\mathbf{S}^{\intercal}$
**Parameters:** `S`: Summing matrix of size (`base`, `bottom`).
**Returns:** `P`: Reconciliation matrix of size (`bottom`,
`base`).
**References:** - [Wickramasuriya, S.L., Turlach, B.A. & Hyndman,
R.J. (2020). “Optimal non-negative forecast reconciliation”. Stat Comput
30, 1167–1182,
https://doi.org/10.1007/s11222-020-09930-0](https://robjhyndman.com/publications/nnmint/).\*
***
source
### get\_mintrace\_wls\_P
> ```text theme={null}
> get_mintrace_wls_P (S:numpy.ndarray)
> ```
\*MinTraceOLS Reconciliation Matrix.
Creates MinTraceOLS reconciliation matrix as proposed by Wickramasuriya
et al. Depending on a weighted GLS estimator and an estimator of the
covariance matrix of the coherency errors $\mathbf{W}_{h}$.
$ \mathbf{W}_{h} = \mathrm{Diag}(\mathbf{S} \mathbb{1}_{[b]})$
$$
\mathbf{P}_{\text{MinTraceWLS}}=\left(\mathbf{S}^{\intercal}\mathbf{W}_{h}\mathbf{S}\right)^{-1}
\mathbf{S}^{\intercal}\mathbf{W}^{-1}_{h}
$$
**Parameters:** `S`: Summing matrix of size (`base`, `bottom`).
**Returns:** `P`: Reconciliation matrix of size (`bottom`,
`base`).
**References:** - [Wickramasuriya, S.L., Turlach, B.A. & Hyndman,
R.J. (2020). “Optimal non-negative forecast reconciliation”. Stat Comput
30, 1167–1182,
https://doi.org/10.1007/s11222-020-09930-0](https://robjhyndman.com/publications/nnmint/).\*
## HINT
***
source
### HINT
> ```text theme={null}
> HINT (h:int, S:numpy.ndarray, model, reconciliation:str,
> alias:Optional[str]=None)
> ```
\*HINT
The Hierarchical Mixture Networks (HINT) are a highly modular framework
that combines SoTA neural forecast architectures with a task-specialized
mixture probability and advanced hierarchical reconciliation strategies.
This powerful combination allows HINT to produce accurate and coherent
probabilistic forecasts.
HINT’s incorporates a `TemporalNorm` module into any neural forecast
architecture, the module normalizes inputs into the network’s
non-linearities operating range and recomposes its output’s scales
through a global skip connection, improving accuracy and training
robustness. HINT ensures the forecast coherence via bootstrap sample
reconciliation that restores the aggregation constraints into its base
samples.
Available reconciliations: - BottomUp - MinTraceOLS -
MinTraceWLS - Identity
**Parameters:** `h`: int, Forecast horizon. `model`:
NeuralForecast model, instantiated model class from [architecture
collection](https://nixtlaverse.nixtla.io/neuralforecast/models.html).
`S`: np.ndarray, dumming matrix of size (`base`, `bottom`) see
HierarchicalForecast’s [aggregate
method](https://nixtlaverse.nixtla.io/hierarchicalforecast/src/utils.html#aggregate).
`reconciliation`: str, HINT’s reconciliation method from \[‘BottomUp’,
‘MinTraceOLS’, ‘MinTraceWLS’]. `alias`: str, optional, Custom name
of the model. \*
***
source
### HINT.fit
> ```text theme={null}
> HINT.fit (dataset, val_size=0, test_size=0, random_seed=None,
> distributed_config=None)
> ```
\*HINT.fit
HINT trains on the entire hierarchical dataset, by minimizing a
composite log likelihood objective. HINT framework integrates
`TemporalNorm` into the neural forecast architecture for a
scale-decoupled optimization that robustifies cross-learning the
hierachy’s series scales.
**Parameters:** `dataset`: NeuralForecast’s
[`TimeSeriesDataset`](https://nixtlaverse.nixtla.io/neuralforecast/tsdataset.html#timeseriesdataset)
see details
[here](https://nixtla.github.io/neuralforecast/tsdataset.html)
`val_size`: int, size of the validation set, (default 0).
`test_size`: int, size of the test set, (default 0). `random_seed`:
int, random seed for the prediction.
**Returns:** `self`: A fitted base
[`NeuralForecast`](https://nixtlaverse.nixtla.io/neuralforecast/core.html#neuralforecast)
model. \*
***
source
### HINT.predict
> ```text theme={null}
> HINT.predict (dataset, step_size=1, random_seed=None,
> **data_module_kwargs)
> ```
\*HINT.predict
After fitting a base model on the entire hierarchical dataset. HINT
restores the hierarchical aggregation constraints using bootstrapped
sample reconciliation.
**Parameters:** `dataset`: NeuralForecast’s
[`TimeSeriesDataset`](https://nixtlaverse.nixtla.io/neuralforecast/tsdataset.html#timeseriesdataset)
see details
[here](https://nixtla.github.io/neuralforecast/tsdataset.html)
`step_size`: int, steps between sequential predictions, (default 1).
`random_seed`: int, random seed for the prediction. `**data_kwarg`:
additional parameters for the dataset module.
**Returns:** `y_hat`: numpy predictions of the
[`NeuralForecast`](https://nixtlaverse.nixtla.io/neuralforecast/core.html#neuralforecast)
model. \*
## Usage Example
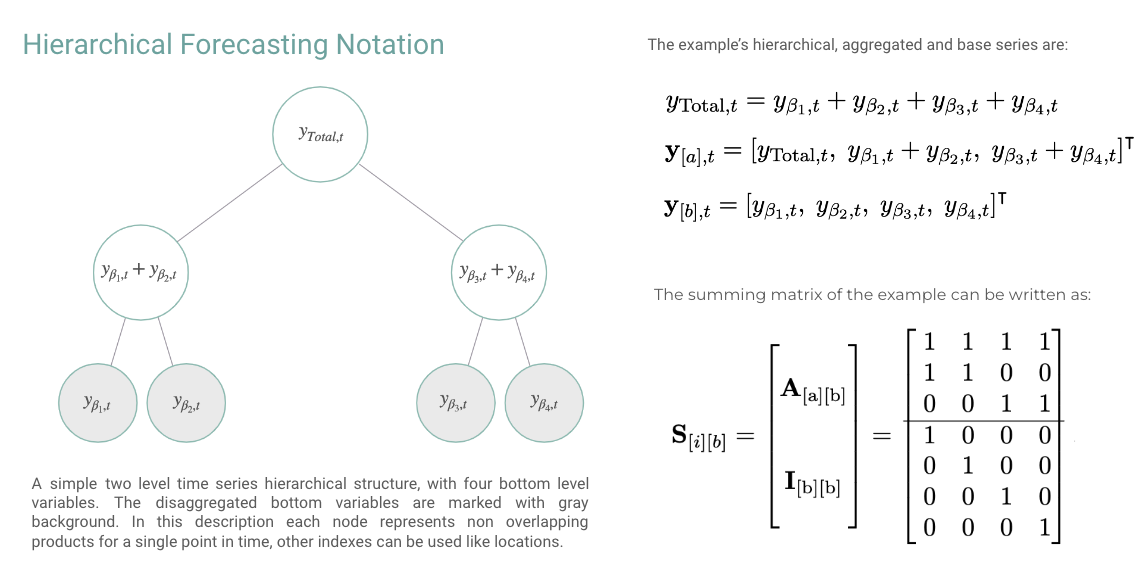
In this example we will use HINT for the hierarchical forecast task, a
multivariate regression problem with aggregation constraints. The
aggregation constraints can be compactcly represented by the summing
matrix $\mathbf{S}_{[i][b]}$, the Figure belows shows an example.
In this example we will make coherent predictions for the TourismL
dataset.
Outline 1. Import packages 2. Load hierarchical dataset 3.
Fit and Predict HINT 4. Forecast Plot
```python theme={null}
import matplotlib.pyplot as plt
from neuralforecast.losses.pytorch import GMM, sCRPS
from datasetsforecast.hierarchical import HierarchicalData
# Auxiliary sorting
def sort_df_hier(Y_df, S_df):
# NeuralForecast core, sorts unique_id lexicographically
# by default, this class matches S_df and Y_hat_df order.
Y_df.unique_id = Y_df.unique_id.astype('category')
Y_df.unique_id = Y_df.unique_id.cat.set_categories(S_df.index)
Y_df = Y_df.sort_values(by=['unique_id', 'ds'])
return Y_df
# Load TourismSmall dataset
horizon = 12
Y_df, S_df, tags = HierarchicalData.load('./data', 'TourismLarge')
Y_df['ds'] = pd.to_datetime(Y_df['ds'])
Y_df = sort_df_hier(Y_df, S_df)
level = [80,90]
# Instantiate HINT
# BaseNetwork + Distribution + Reconciliation
nhits = NHITS(h=horizon,
input_size=24,
loss=GMM(n_components=10, level=level),
max_steps=2000,
early_stop_patience_steps=10,
val_check_steps=50,
scaler_type='robust',
learning_rate=1e-3,
valid_loss=sCRPS(level=level))
model = HINT(h=horizon, S=S_df.values,
model=nhits, reconciliation='BottomUp')
# Fit and Predict
nf = NeuralForecast(models=[model], freq='MS')
Y_hat_df = nf.cross_validation(df=Y_df, val_size=12, n_windows=1)
Y_hat_df = Y_hat_df.reset_index()
```
```python theme={null}
# Plot coherent probabilistic forecast
unique_id = 'TotalAll'
Y_plot_df = Y_df[Y_df.unique_id==unique_id]
plot_df = Y_hat_df[Y_hat_df.unique_id==unique_id]
plot_df = Y_plot_df.merge(plot_df, on=['ds', 'unique_id'], how='left')
n_years = 5
plt.plot(plot_df['ds'][-12*n_years:], plot_df['y_x'][-12*n_years:], c='black', label='True')
plt.plot(plot_df['ds'][-12*n_years:], plot_df['HINT'][-12*n_years:], c='purple', label='mean')
plt.plot(plot_df['ds'][-12*n_years:], plot_df['HINT-median'][-12*n_years:], c='blue', label='median')
plt.fill_between(x=plot_df['ds'][-12*n_years:],
y1=plot_df['HINT-lo-90'][-12*n_years:].values,
y2=plot_df['HINT-hi-90'][-12*n_years:].values,
alpha=0.4, label='level 90')
plt.legend()
plt.grid()
plt.plot()
```

 ```python theme={null}
import matplotlib.pyplot as plt
from neuralforecast.losses.pytorch import GMM, sCRPS
from datasetsforecast.hierarchical import HierarchicalData
# Auxiliary sorting
def sort_df_hier(Y_df, S_df):
# NeuralForecast core, sorts unique_id lexicographically
# by default, this class matches S_df and Y_hat_df order.
Y_df.unique_id = Y_df.unique_id.astype('category')
Y_df.unique_id = Y_df.unique_id.cat.set_categories(S_df.index)
Y_df = Y_df.sort_values(by=['unique_id', 'ds'])
return Y_df
# Load TourismSmall dataset
horizon = 12
Y_df, S_df, tags = HierarchicalData.load('./data', 'TourismLarge')
Y_df['ds'] = pd.to_datetime(Y_df['ds'])
Y_df = sort_df_hier(Y_df, S_df)
level = [80,90]
# Instantiate HINT
# BaseNetwork + Distribution + Reconciliation
nhits = NHITS(h=horizon,
input_size=24,
loss=GMM(n_components=10, level=level),
max_steps=2000,
early_stop_patience_steps=10,
val_check_steps=50,
scaler_type='robust',
learning_rate=1e-3,
valid_loss=sCRPS(level=level))
model = HINT(h=horizon, S=S_df.values,
model=nhits, reconciliation='BottomUp')
# Fit and Predict
nf = NeuralForecast(models=[model], freq='MS')
Y_hat_df = nf.cross_validation(df=Y_df, val_size=12, n_windows=1)
Y_hat_df = Y_hat_df.reset_index()
```
```python theme={null}
# Plot coherent probabilistic forecast
unique_id = 'TotalAll'
Y_plot_df = Y_df[Y_df.unique_id==unique_id]
plot_df = Y_hat_df[Y_hat_df.unique_id==unique_id]
plot_df = Y_plot_df.merge(plot_df, on=['ds', 'unique_id'], how='left')
n_years = 5
plt.plot(plot_df['ds'][-12*n_years:], plot_df['y_x'][-12*n_years:], c='black', label='True')
plt.plot(plot_df['ds'][-12*n_years:], plot_df['HINT'][-12*n_years:], c='purple', label='mean')
plt.plot(plot_df['ds'][-12*n_years:], plot_df['HINT-median'][-12*n_years:], c='blue', label='median')
plt.fill_between(x=plot_df['ds'][-12*n_years:],
y1=plot_df['HINT-lo-90'][-12*n_years:].values,
y2=plot_df['HINT-hi-90'][-12*n_years:].values,
alpha=0.4, label='level 90')
plt.legend()
plt.grid()
plt.plot()
```
```python theme={null}
import matplotlib.pyplot as plt
from neuralforecast.losses.pytorch import GMM, sCRPS
from datasetsforecast.hierarchical import HierarchicalData
# Auxiliary sorting
def sort_df_hier(Y_df, S_df):
# NeuralForecast core, sorts unique_id lexicographically
# by default, this class matches S_df and Y_hat_df order.
Y_df.unique_id = Y_df.unique_id.astype('category')
Y_df.unique_id = Y_df.unique_id.cat.set_categories(S_df.index)
Y_df = Y_df.sort_values(by=['unique_id', 'ds'])
return Y_df
# Load TourismSmall dataset
horizon = 12
Y_df, S_df, tags = HierarchicalData.load('./data', 'TourismLarge')
Y_df['ds'] = pd.to_datetime(Y_df['ds'])
Y_df = sort_df_hier(Y_df, S_df)
level = [80,90]
# Instantiate HINT
# BaseNetwork + Distribution + Reconciliation
nhits = NHITS(h=horizon,
input_size=24,
loss=GMM(n_components=10, level=level),
max_steps=2000,
early_stop_patience_steps=10,
val_check_steps=50,
scaler_type='robust',
learning_rate=1e-3,
valid_loss=sCRPS(level=level))
model = HINT(h=horizon, S=S_df.values,
model=nhits, reconciliation='BottomUp')
# Fit and Predict
nf = NeuralForecast(models=[model], freq='MS')
Y_hat_df = nf.cross_validation(df=Y_df, val_size=12, n_windows=1)
Y_hat_df = Y_hat_df.reset_index()
```
```python theme={null}
# Plot coherent probabilistic forecast
unique_id = 'TotalAll'
Y_plot_df = Y_df[Y_df.unique_id==unique_id]
plot_df = Y_hat_df[Y_hat_df.unique_id==unique_id]
plot_df = Y_plot_df.merge(plot_df, on=['ds', 'unique_id'], how='left')
n_years = 5
plt.plot(plot_df['ds'][-12*n_years:], plot_df['y_x'][-12*n_years:], c='black', label='True')
plt.plot(plot_df['ds'][-12*n_years:], plot_df['HINT'][-12*n_years:], c='purple', label='mean')
plt.plot(plot_df['ds'][-12*n_years:], plot_df['HINT-median'][-12*n_years:], c='blue', label='median')
plt.fill_between(x=plot_df['ds'][-12*n_years:],
y1=plot_df['HINT-lo-90'][-12*n_years:].values,
y2=plot_df['HINT-hi-90'][-12*n_years:].values,
alpha=0.4, label='level 90')
plt.legend()
plt.grid()
plt.plot()
```